
Interesting Datasets
Interesting Datasets #01: LiDAR. What Can You Learn About a Property From the Air?
Exploring England's open LiDAR data and what useful property intelligence we can manufacture from it.
Jamie McCann · · 9 min read
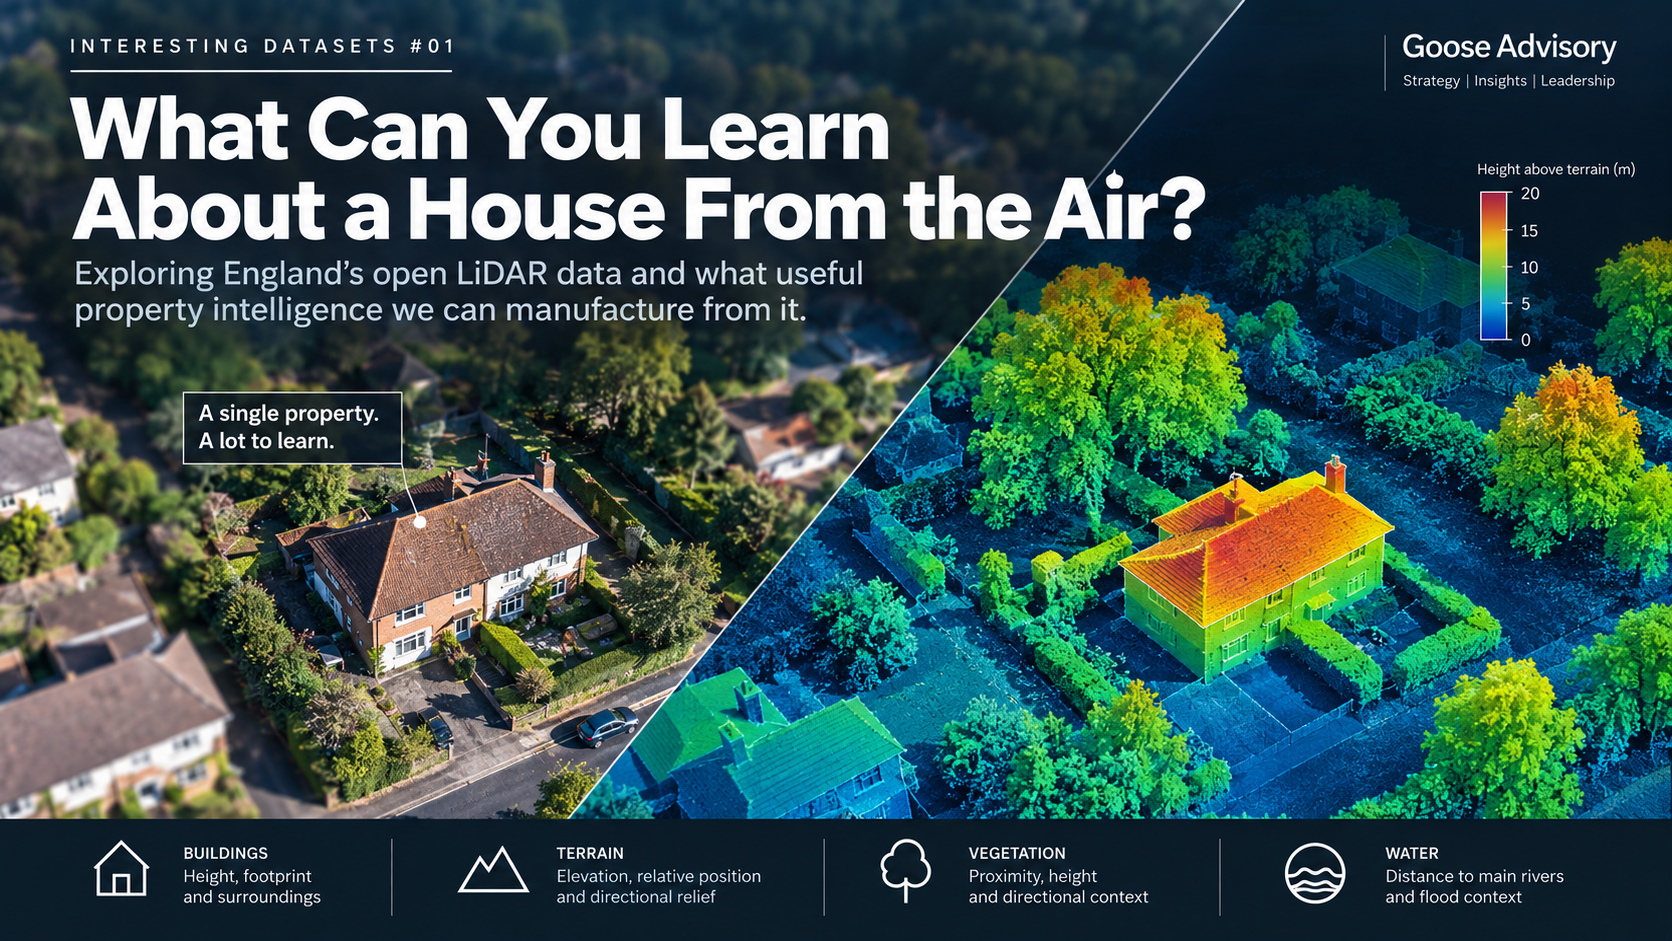
I like interesting datasets.
Not necessarily the obvious ones. Often the most interesting are datasets collected for one purpose that turn out to be useful for something quite different.
So, for the first in a new series, I thought I'd start with LiDAR.
For many people working with geospatial data, LiDAR will be very familiar. But I suspect fewer people working in insurance have had reason to look closely at the underlying data or experiment with what can be derived from it.
So that's what we did.
We picked one real, ordinary property in England and asked a simple question:
What can we actually learn about a property if we start with open LiDAR data and follow our curiosity?
Importantly, we didn't want to produce a theoretical list of things that might be possible.
We downloaded the data, matched it to a real building and started calculating the features.
Starting with LiDAR
The Environment Agency has made detailed elevation data available across England.
One of the useful things about the data is that we can access both a Digital Surface Model (DSM) and a Digital Terrain Model (DTM).
The distinction matters.
The DSM describes the surface, including buildings and vegetation.
The DTM attempts to describe the underlying ground.
Subtract one from the other and something interesting happens.
DSM − DTM = height above the surrounding terrain.
Buildings start to emerge. Trees emerge. The physical structure of a place becomes much easier to see.
And that's where our experiment started to get interesting.
The data we used
LiDAR was our starting point, but not our finishing point.
As the questions developed, we combined the Environment Agency's 1m LiDAR data with Overture Maps building footprints, the Environment Agency's Statutory Main River Map, flood risk data and Vegetation Object Model.
The features and measurements below are actual outputs we calculated for our test property from those underlying datasets.
Finding the house
Our starting point was a UPRN (Unique Property Reference Number).
Like many property datasets, that gives us a location represented by a point.
But a house isn't a point.
So we combined the LiDAR with building footprint data and associated our test property with the physical building containing its UPRN.
That immediately changed the unit of analysis.
Instead of asking what the elevation is at one coordinate, we could examine the entire structure.
The physical building footprint in our example was approximately 333m².
Across that footprint, we calculated a robust upper building height of approximately 6.8 metres above the terrain.
Interestingly, the LiDAR height at the UPRN point itself was only 5.6 metres.
Neither number is inherently wrong. They answer different questions.
One describes a one-metre cell at an address point.
The other describes the height distribution across the physical building.
That distinction turned out to matter elsewhere too.
Could we understand the roof?
This was one of the things I was particularly curious about.
If we have a metre-by-metre representation of height across the building, could we identify the shape of the roof?
To a degree, yes.
We measured clear variation across the roof surface and found a coherent elevated structure.
But this was also where we found one of the limits of the experiment.
At one-metre resolution, we didn't think the evidence was strong enough to reliably infer an exact roof pitch, orientation or roof type for this property.
We could probably have produced an answer but that isn't the same as producing a reliable answer.
So we didn't turn those into features.
Moving beyond the building
Once we had the physical building, we started looking at its surroundings.
This is where the experiment moved from extracting information already present in a dataset to manufacturing new property characteristics by combining datasets and spatial calculations.
For example, we calculated the property's ground elevation at approximately 22.7 metres.
But absolute elevation wasn't particularly interesting on its own.
So we compared it with the terrain around the building.
The property sits roughly around the middle of the local elevation distribution. But its surroundings are highly directional.
At around 75 metres from the property, terrain to the north is approximately 6.4 metres higher than the property's ground level.
To the south-east it is approximately 2.6 metres lower.
That's almost 9 metres of directional terrain variation within a relatively small area.
We now had features describing not simply elevation, but local terrain prominence, relative elevation and directional terrain exposure.
These aren't theoretical possibilities. We'd calculated them.
What does the wind see?
That led to another question.
Windstorm exposure obviously involves far more than LiDAR. Regional wind hazard, construction, roof condition, storm direction and many other factors matter.
But could we manufacture useful characteristics describing the physical environment around a building?
So we measured it.
Our test building is approximately 6.8 metres high. The median height of nearby buildings was approximately 10.2 metres, making our building around 3.3 metres lower than its typical nearby neighbours.
Then we looked around the building in 16 directions.
In 13 of the 16 directions, another mapped building was encountered within 75 metres.
But in three contiguous directions, south, south-south-west and south-west, there wasn't one.
That gives us a measurable building-open sector of approximately 67.5 degrees.
Now combine that with the terrain.
The same broad southern side of the property that is relatively open to buildings also sits towards the lower terrain.
That's a much richer description of the property's physical surroundings than simply calling it "urban" or "built-up".
It doesn't give us a windstorm risk score.
But it gives us actual calculated characteristics that we could test to see whether they help explain one.
And what about vegetation?
That question took us to another Environment Agency dataset, its Vegetation Object Model.
Rather than simply recording that vegetation exists around the property, we calculated its physical relationship to the building.
The nearest classified vegetation more than five metres high was approximately 4.9 metres from the building.
Within ten metres of the property, classified vegetation reached almost 14 metres high.
Within fifty metres, it reached just over 17 metres.
Its distribution was directional too.
So we manufactured another set of features describing vegetation proximity, canopy height, vegetation density by distance and directional vegetation context.
There are important limitations.
The data identifies classified vegetation canopy, not individually surveyed trees. It doesn't tell us the condition of a tree, whether it might fall or whether it will cause an insurance claim.
But it gives us measurable physical characteristics that didn't previously exist in our property record.
What had we actually manufactured?
At this point it was worth taking stock.
We'd started with a property identifier and open elevation data.
For the test property, we had now actually calculated numerous variables including:
- Physical building footprint. approximately 333m²
- Building height. approximately 6.8m
- Ground elevation. approximately 22.7m
- Local terrain position. around the middle of the surrounding terrain
- Directional terrain relief. almost 9m
- Relative building height. approximately 3.3m below the median nearby building
- Built-environment enclosure. another building within 75m in 13 of 16 directions
- Building-open sector. approximately 67.5°, from south towards south-west
- Nearest classified vegetation over 5m. approximately 4.9m from the building
- Maximum classified vegetation height within 10m. approximately 13.9m
- Maximum classified vegetation height within 50m. approximately 17.1m
- Distance from the physical building to a Main River. approximately 35.6m
These aren't examples of features we think could theoretically be created.
They are outputs we actually calculated from the underlying data for the property.
Some feel immediately interesting. Some may prove useful for insurance, some less so. We'd love to find out!
A property is not a point
One finding surprised me enough to deserve a separate article.
Measured from the UPRN point, the nearby Main River was approximately 62 metres away.
Measured from the actual physical building, it was approximately 36 metres away.
A difference of more than 26 metres simply because we changed what we meant by "the property".
We then compared the point and the building with Environment Agency flood extents.
That produced an even more interesting result. I'll come back to that separately.
The interesting bit wasn't really LiDAR
What started as an experiment with LiDAR gradually became something else.
LiDAR provided height and terrain.
Building footprints gave that elevation data physical structure.
River and flood data provided environmental context.
Vegetation data added another description of the immediate surroundings.
Spatial analysis allowed us to manufacture new variables from the relationships between them.
The interesting thing isn't the dataset. It's what you can manufacture from it.
There was another useful lesson too.
Not everything worked.
We couldn't reliably determine exact roof orientation from the one-metre data. One apparently very tall neighbouring structure deserved further investigation rather than blindly becoming an underwriting variable. And some Environment Agency flood-depth information simply wasn't available for our location.
The objective isn't to manufacture as many variables as possible, it's to manufacture information we can trust.
From one property to an insurance portfolio
We deliberately experimented on one property.
The more interesting insurance question is what happens at portfolio scale.
Take 500,000 insured properties.
Manufacture the same characteristics consistently for each one, then join them to historical claims.
- Do properties with greater open fetch experience different storm losses?
- Does height relative to neighbouring buildings matter?
- Does nearby tall vegetation add information?
- Does local terrain improve our understanding of exposure?
- Does modelling the physical building rather than an address point change what we see?
- Can these feature 'families' extend to commercial property where physical data can often be sparse? (hint: 100% yes!)
Some of these features will probably tell us nothing. Others might contain useful signals for underwriting, pricing, portfolio management, customer journeys or claims.
Finding out is the interesting bit.
And it doesn't have to be property
While doing this, I kept wondering where else the same approach could take us.
What could LiDAR contribute to motor insurance?
Could we combine detailed physical information about roads and junctions with STATS19 collision data and look for relationships we haven't measured before?
Could road, building and other spatial data help us develop features such as the likelihood of on-street parking, and then test whether those features tell us anything about claims?
Again, I don't know.
But they're interesting questions.
And that's really what this series is about.
Find an interesting dataset. Ask some questions of it. Combine it with something else. Manufacture a few features. Then see whether they actually tell us anything useful.
There is an extraordinary amount of open data available about the world around us.
We'll keep exploring it.
Want to explore the data?
The principal datasets used in this experiment are publicly available:
- Environment Agency: LiDAR Composite Digital Surface Model (DSM), 1m
- Environment Agency: LiDAR Composite Digital Terrain Model (DTM), 1m
- Environment Agency: Vegetation Object Model
- Environment Agency: Statutory Main River Map
- Environment Agency: Rivers and Sea flood risk data
- Overture Maps Foundation Buildings
I know there are numerous commercial datasets available that would have enhanced this analysis, but I've left them out of scope... for now.